Attention Radar, 2012
political attention infographics website
Attention Radar is a web app that visualizes large data sets monitoring political agendas of the Netherlands and the European Union. The data was collected by Montesquieu Institute in The Hague and covers a total time range of 67 years. Its overall volume includes coalition agreements, law proposals, speeches by Queen Beatrix and conclusions by the European Council and exceeds the amount of 61,000 database entries.
The interactive visualization is optimized for iPad and uses the form of a stacked area chart to show the attention put to relevant social issues. It allows to explore how trends surface in the political debate and develop over time. The display of the graph can be customized through a miniature timeline and an interactive control panel. Features include switching between data models and sources, sorting, filtering and zooming.
For an enhanced usability Attention Radar also exploits iPad-specific interactions like rotating or gestures. Swiping for example allows to adjust the data sets, while rotating the tablet enables the comparative view mode with two data sets on top of each other.
All in all, a fully interactive hands-on learning experience for academic research.
Check out the interactive version here.
programming: Michał Ejdys and Pascal de Man; data: Montesquieu Institute; copyright: Living Lab, The Hague and Mind Design, Amsterdam
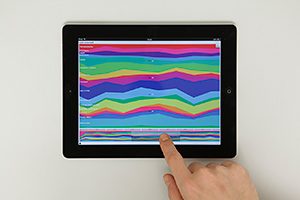
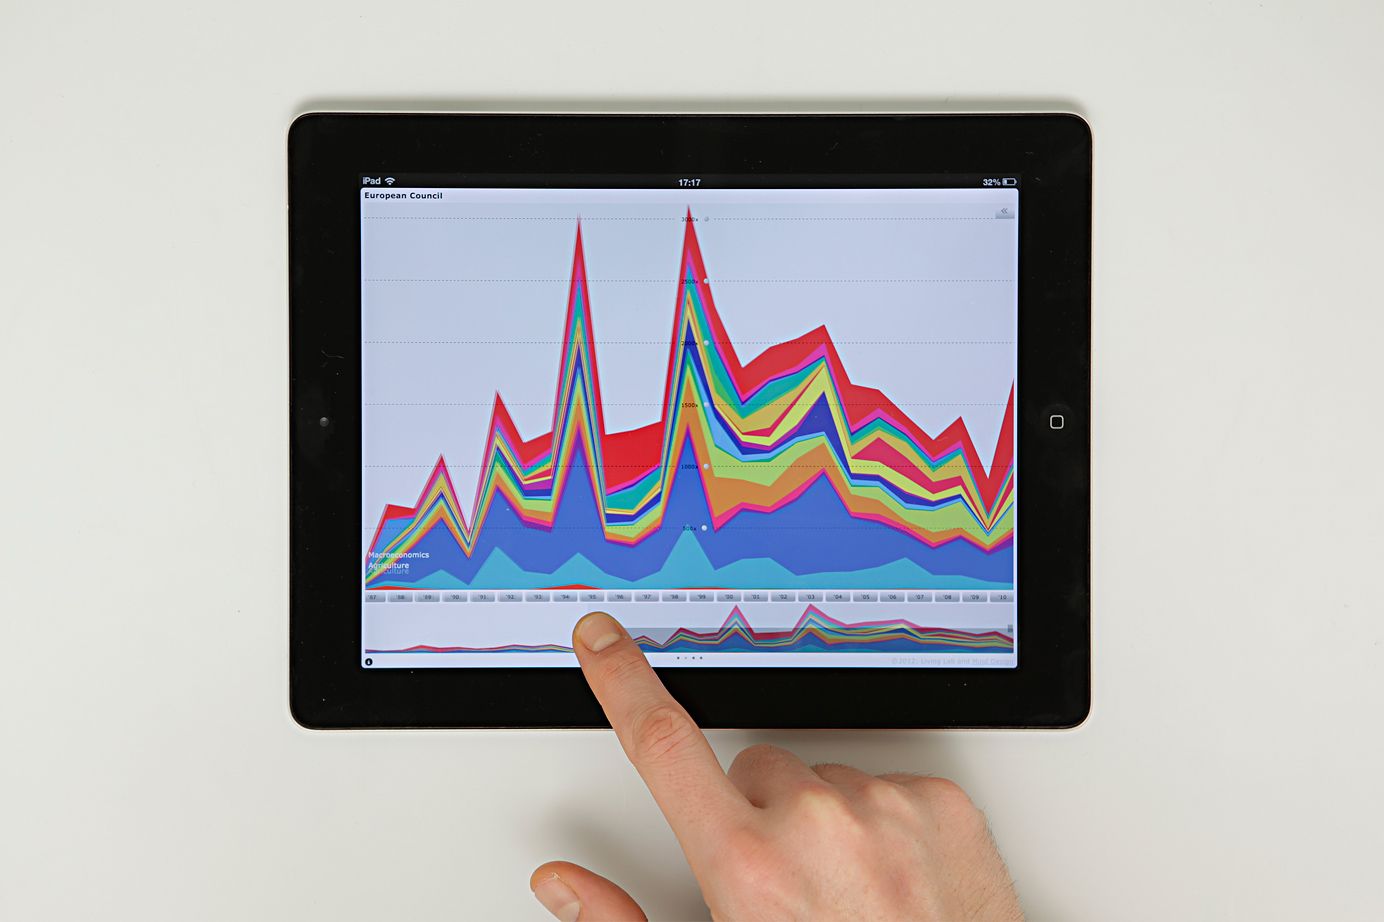
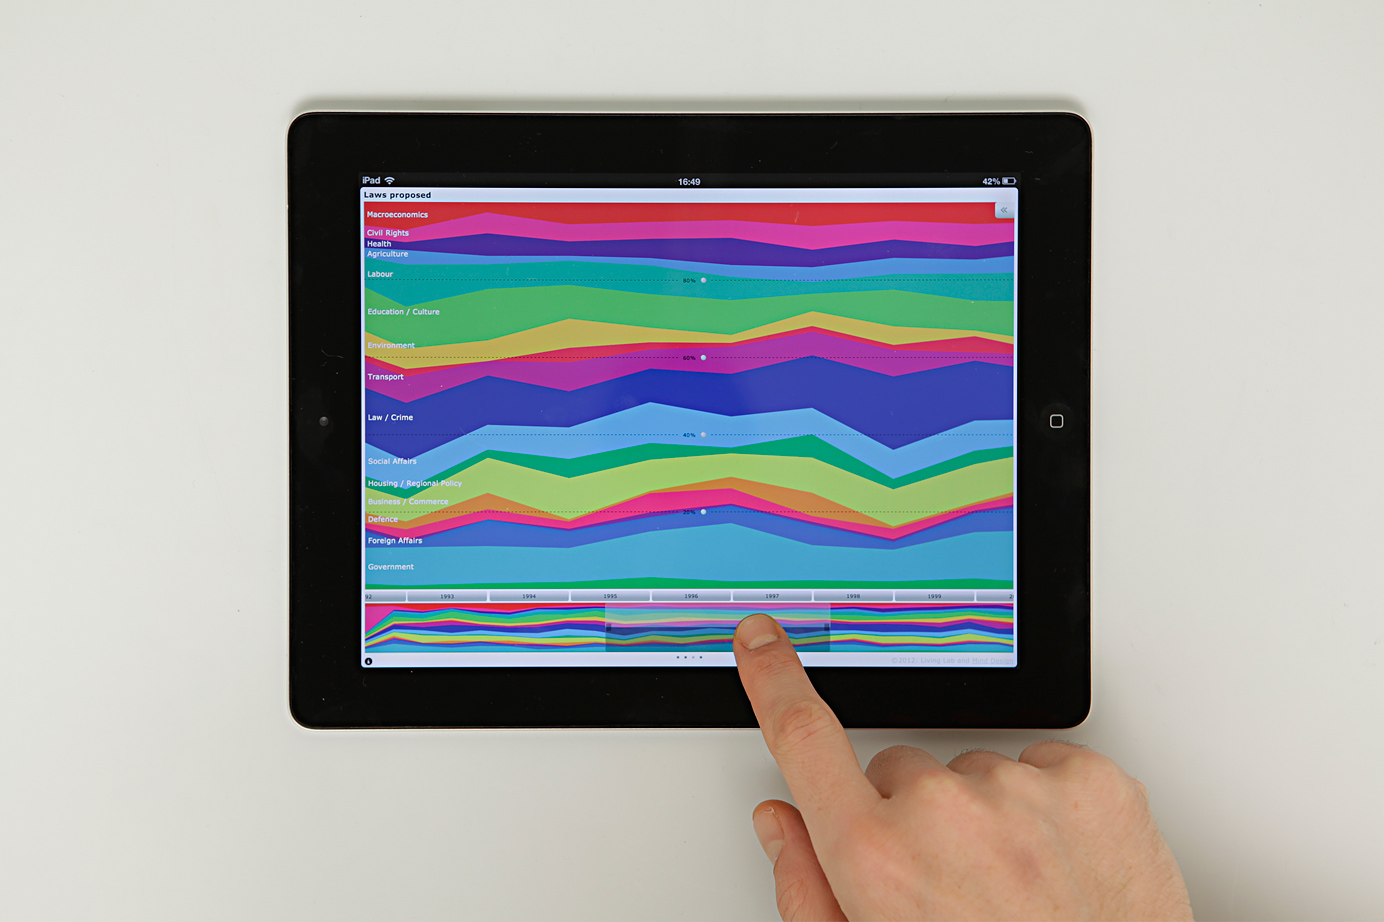 The miniature timeline on the bottom allows customizing the width of the graph. – All photos by Roel Backaert
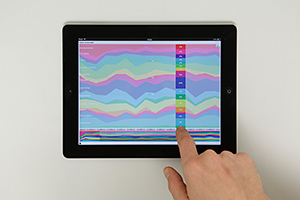
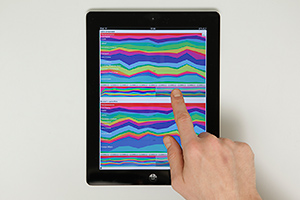
 Tapping on a year reveals all its values.
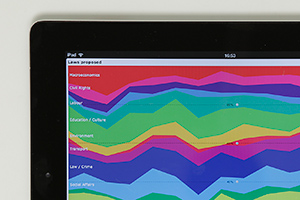
 Labels mark the individual policy agendas.
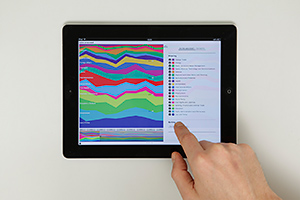
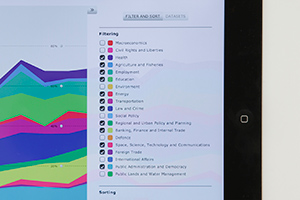
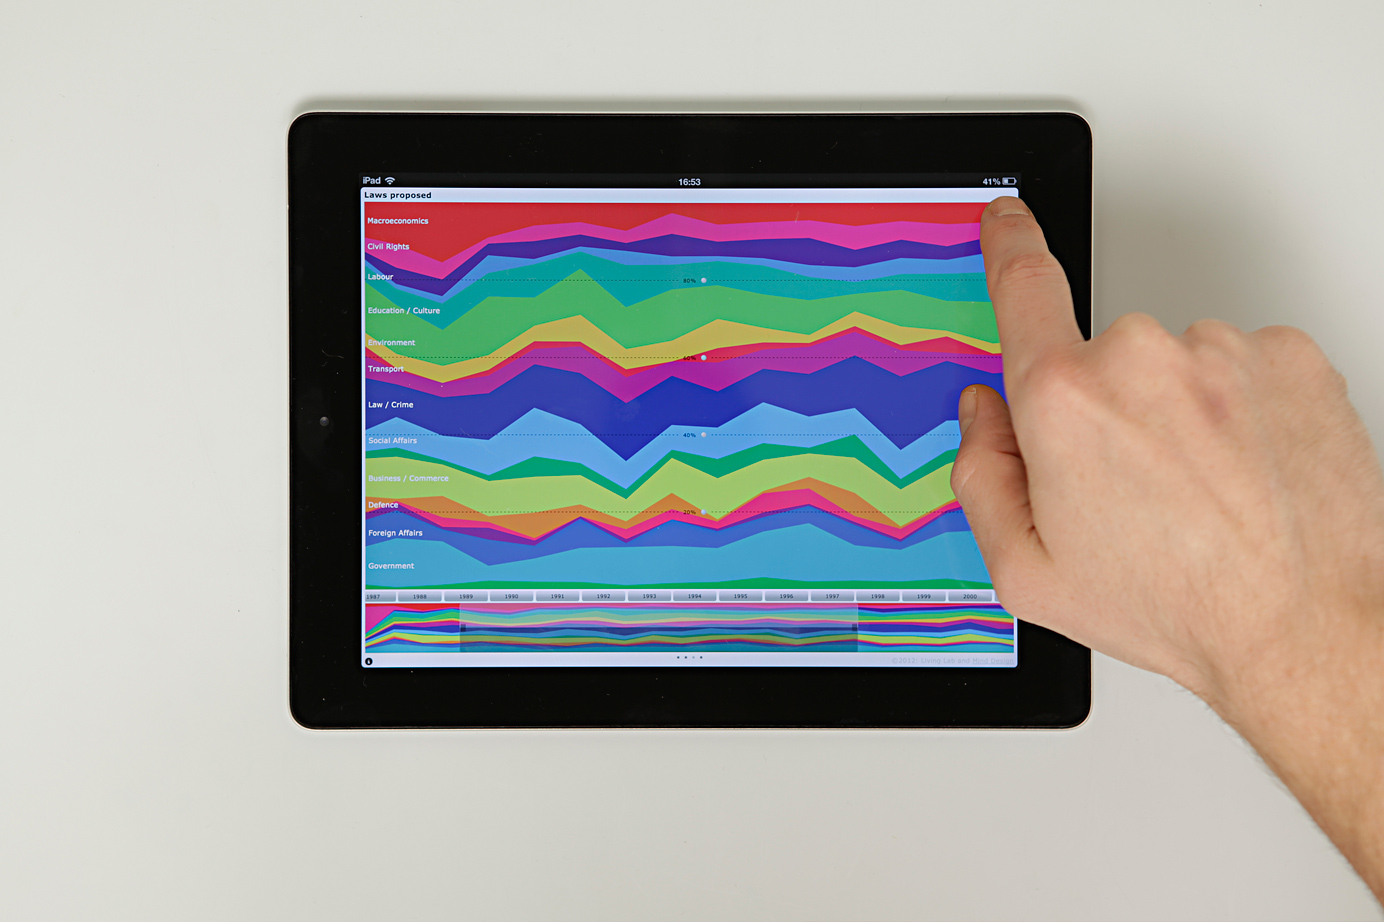 The right top button gives access to the control panel.
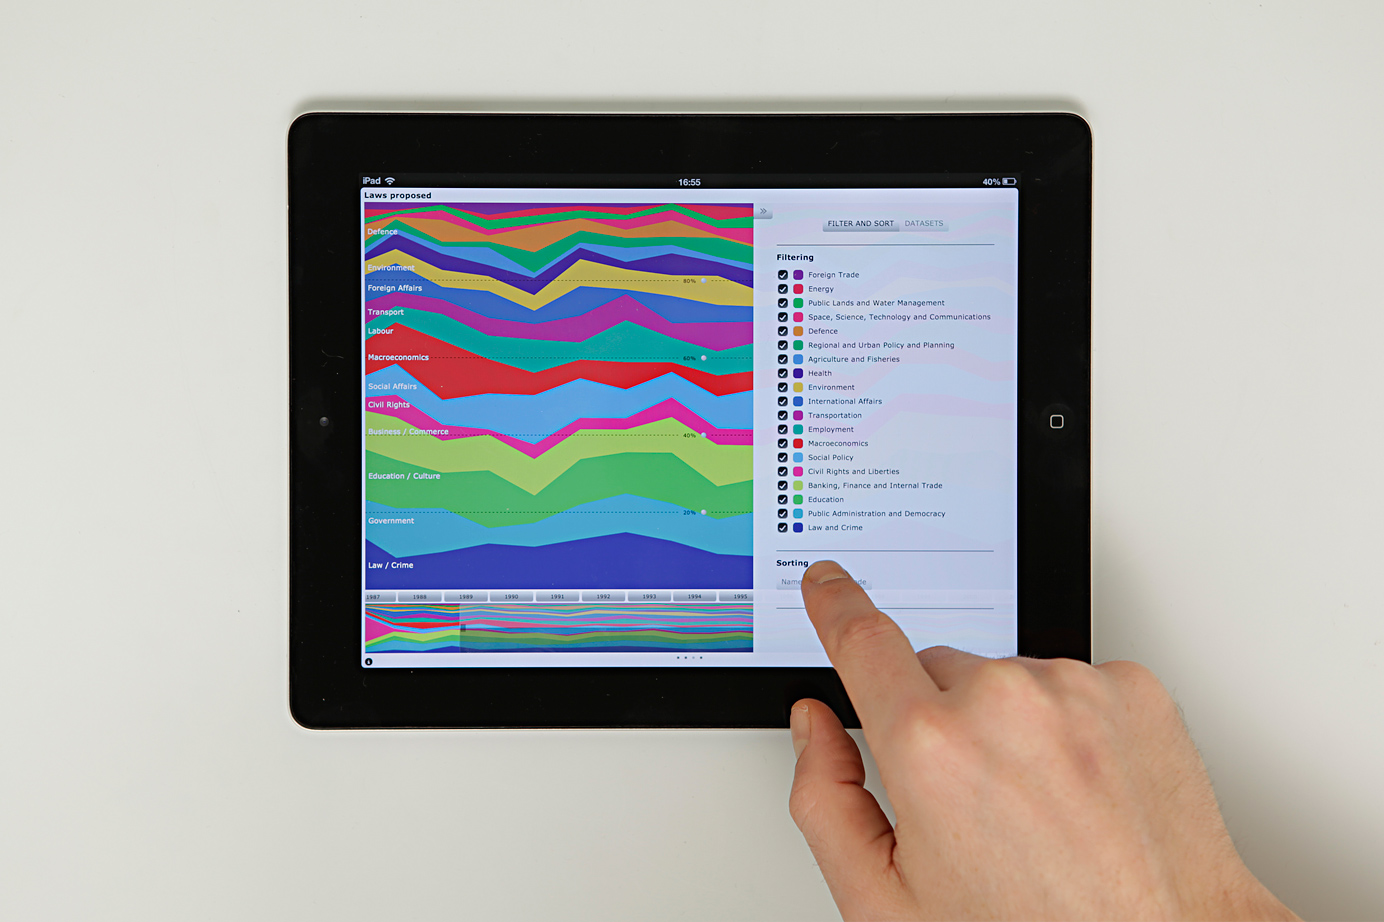 The panel presents the controls to change the sorting according to name, size or code.
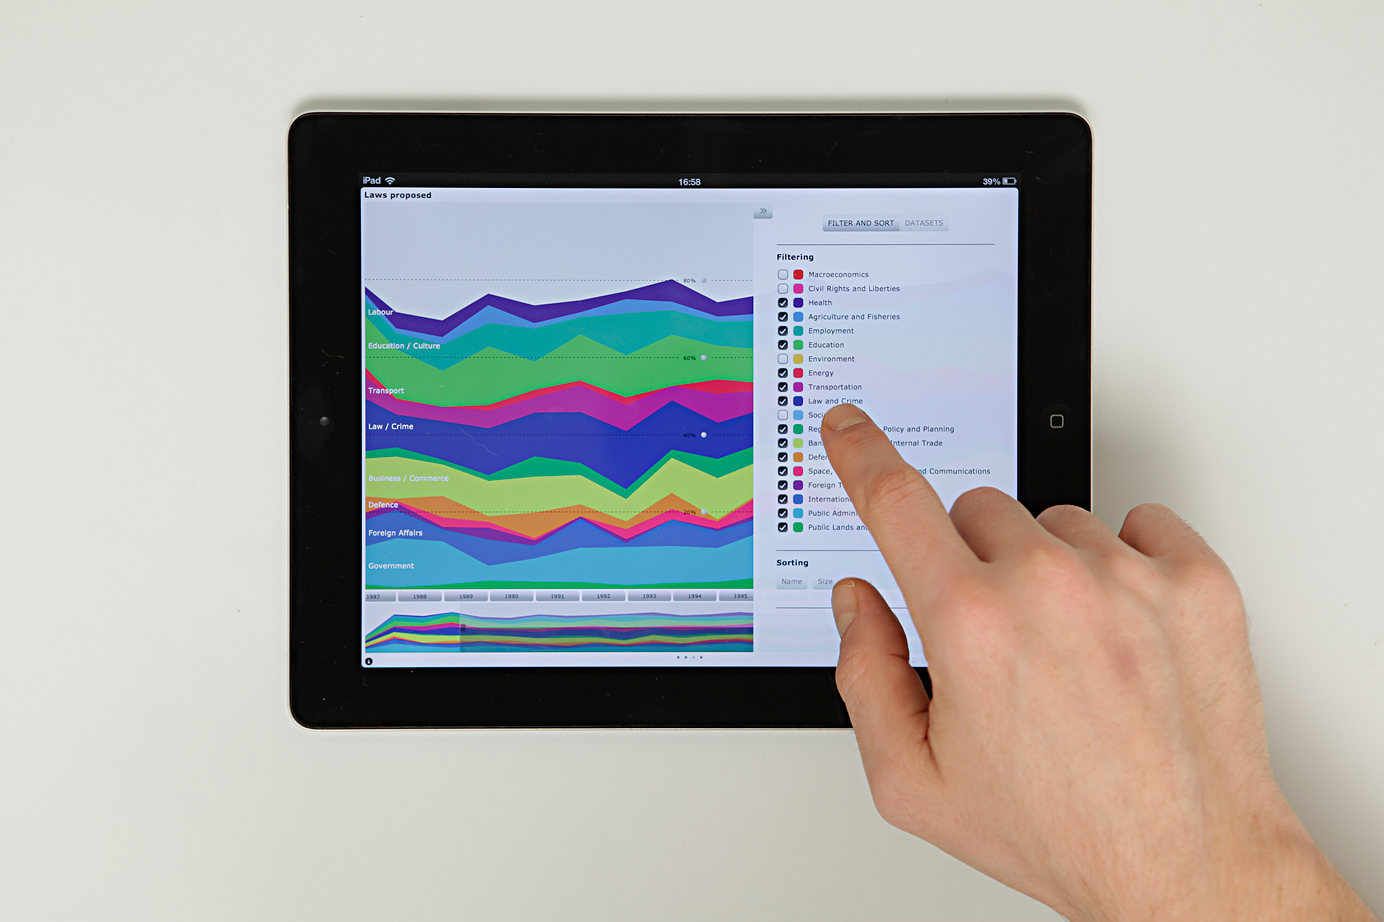
 Unchecking a category removes the given series from the visualization.
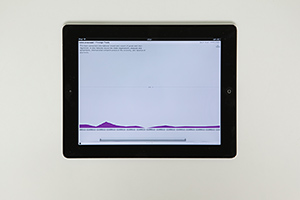
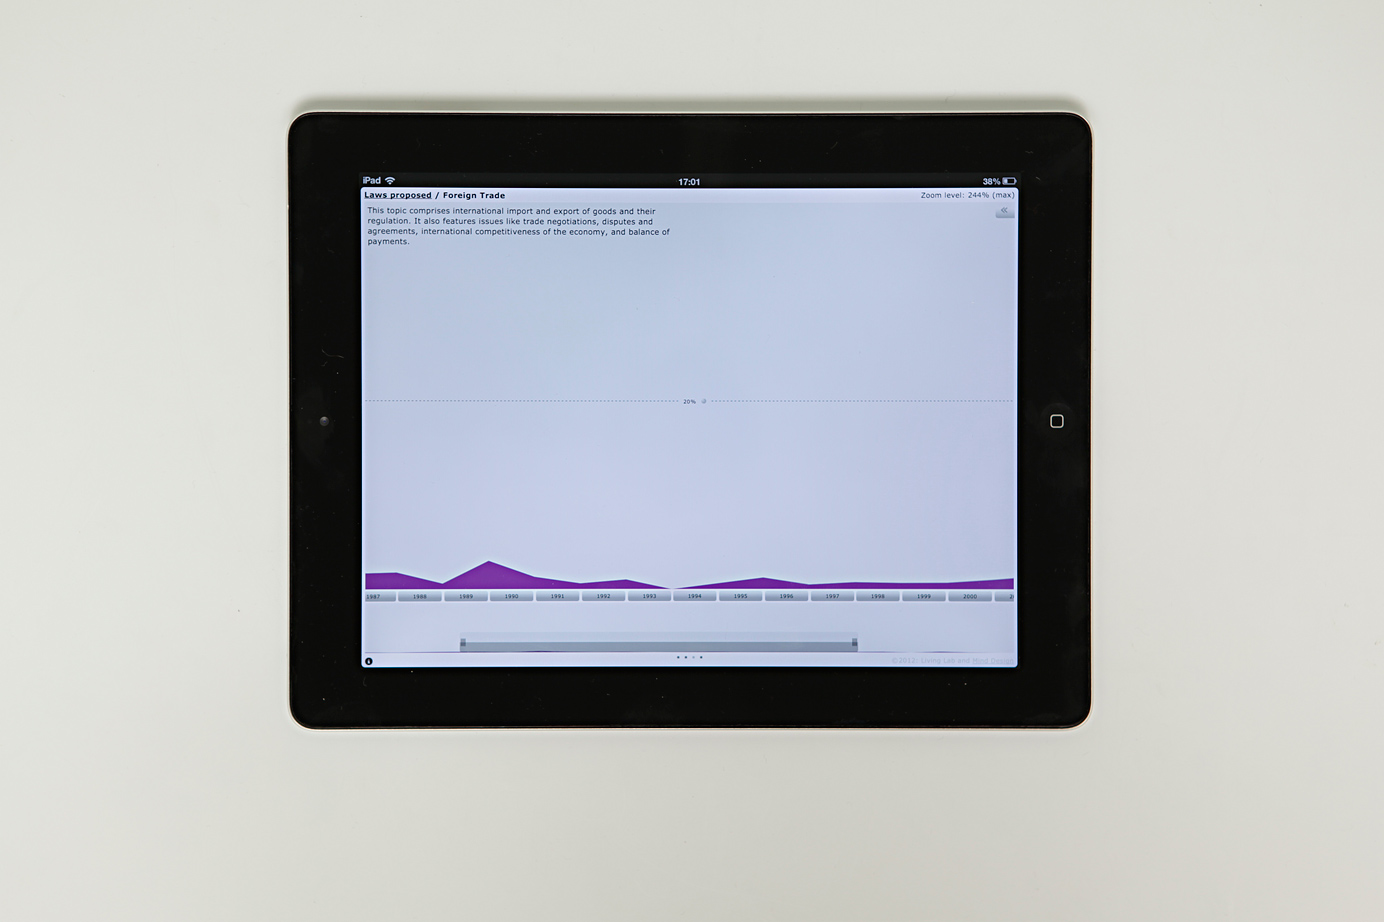 Tapping on a single series in the overview reveals the single chart mode.
 Tapping again shows the subcategories of a selected topic.
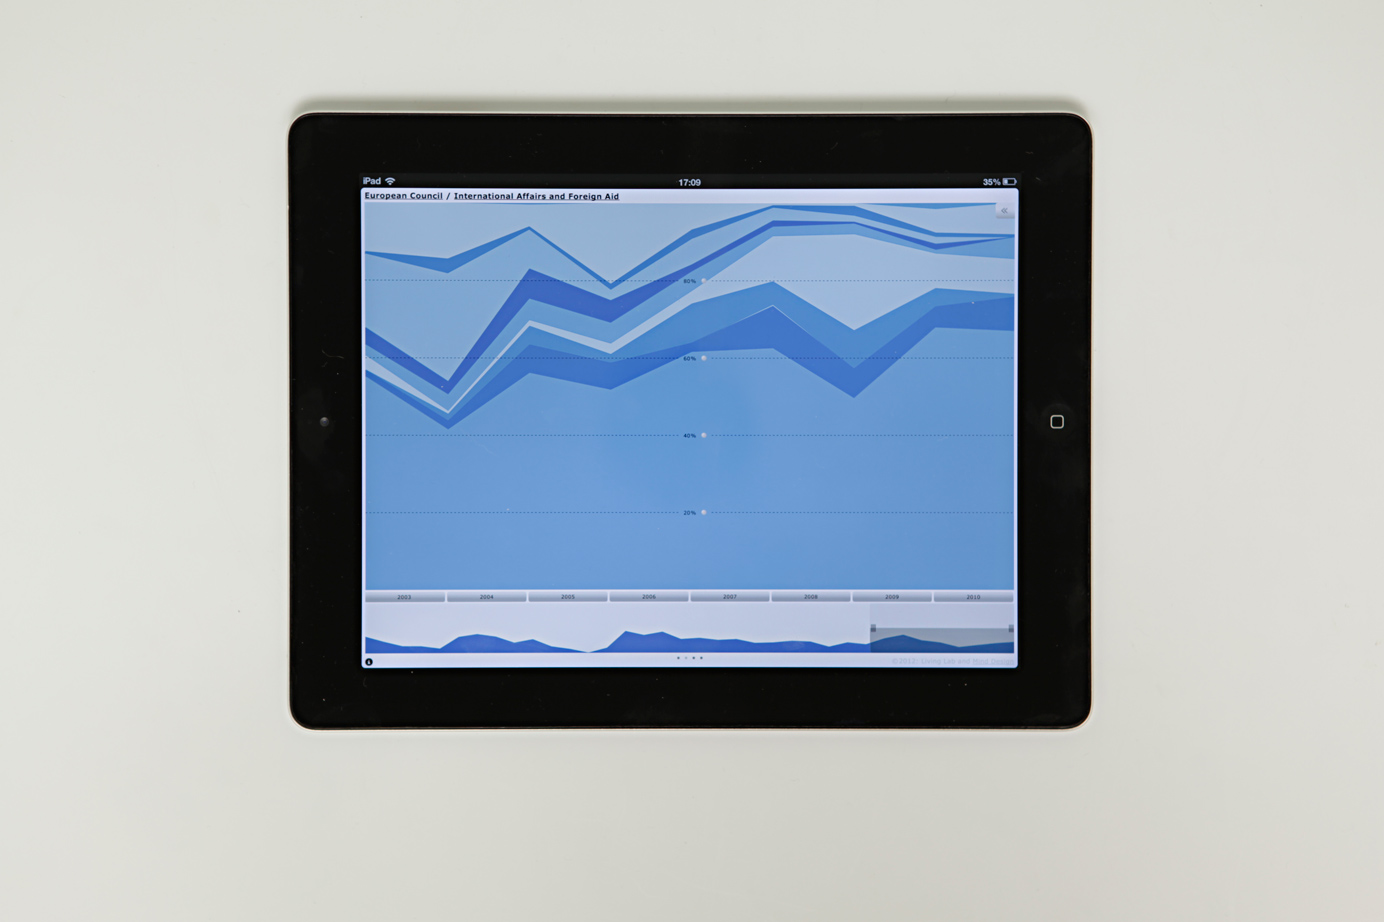
 The software offers to switch between absolute and relative values.
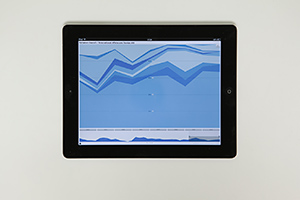
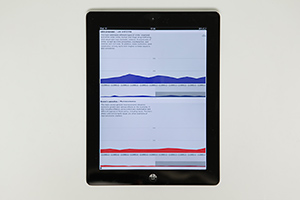
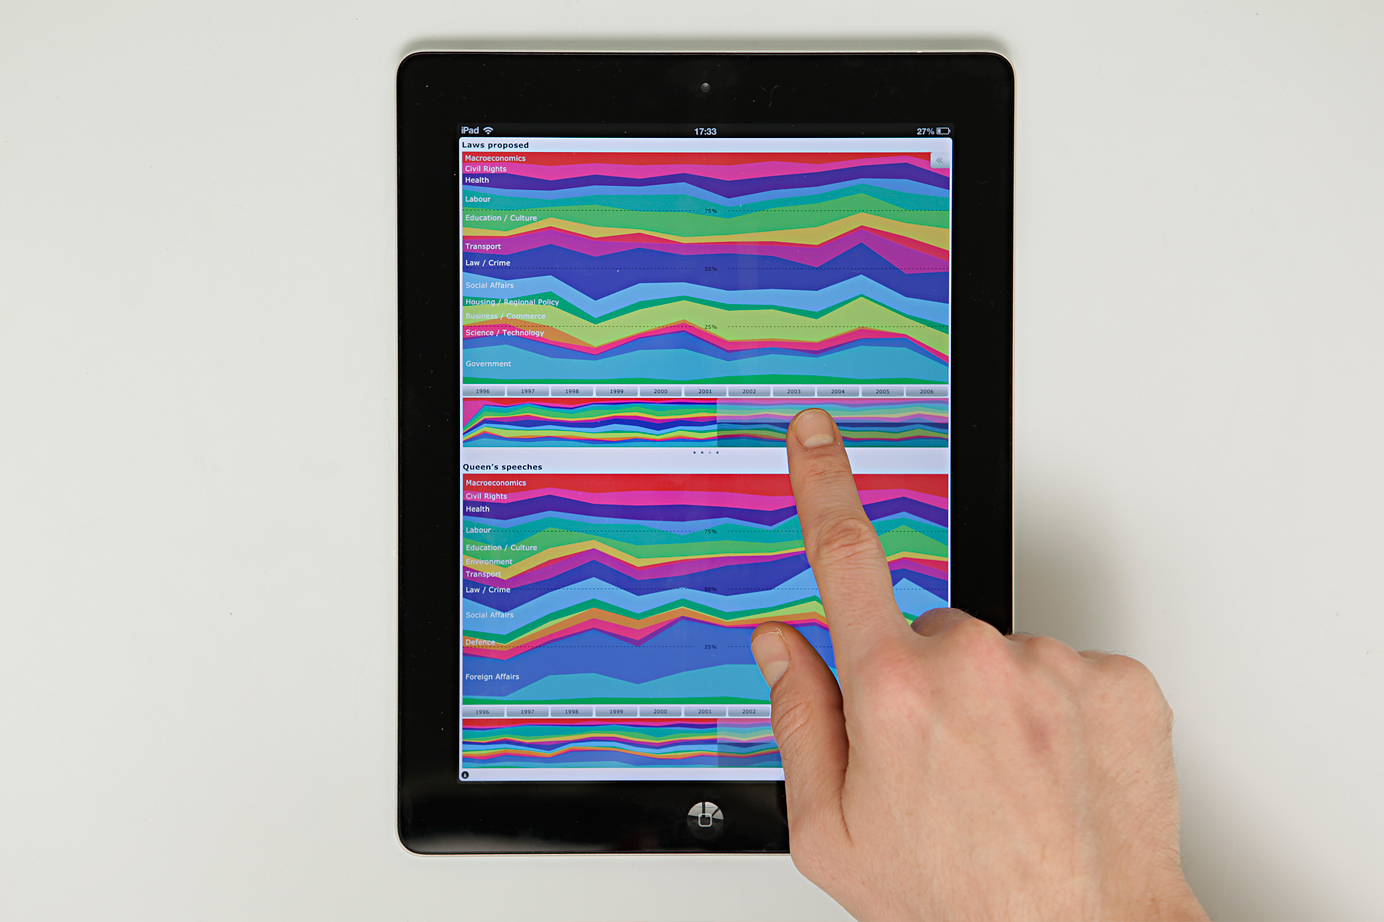 Rotating the iPad allows comparing two selected datasets.
 The comparison mode enables analysing trends in one category over time in different datasets.
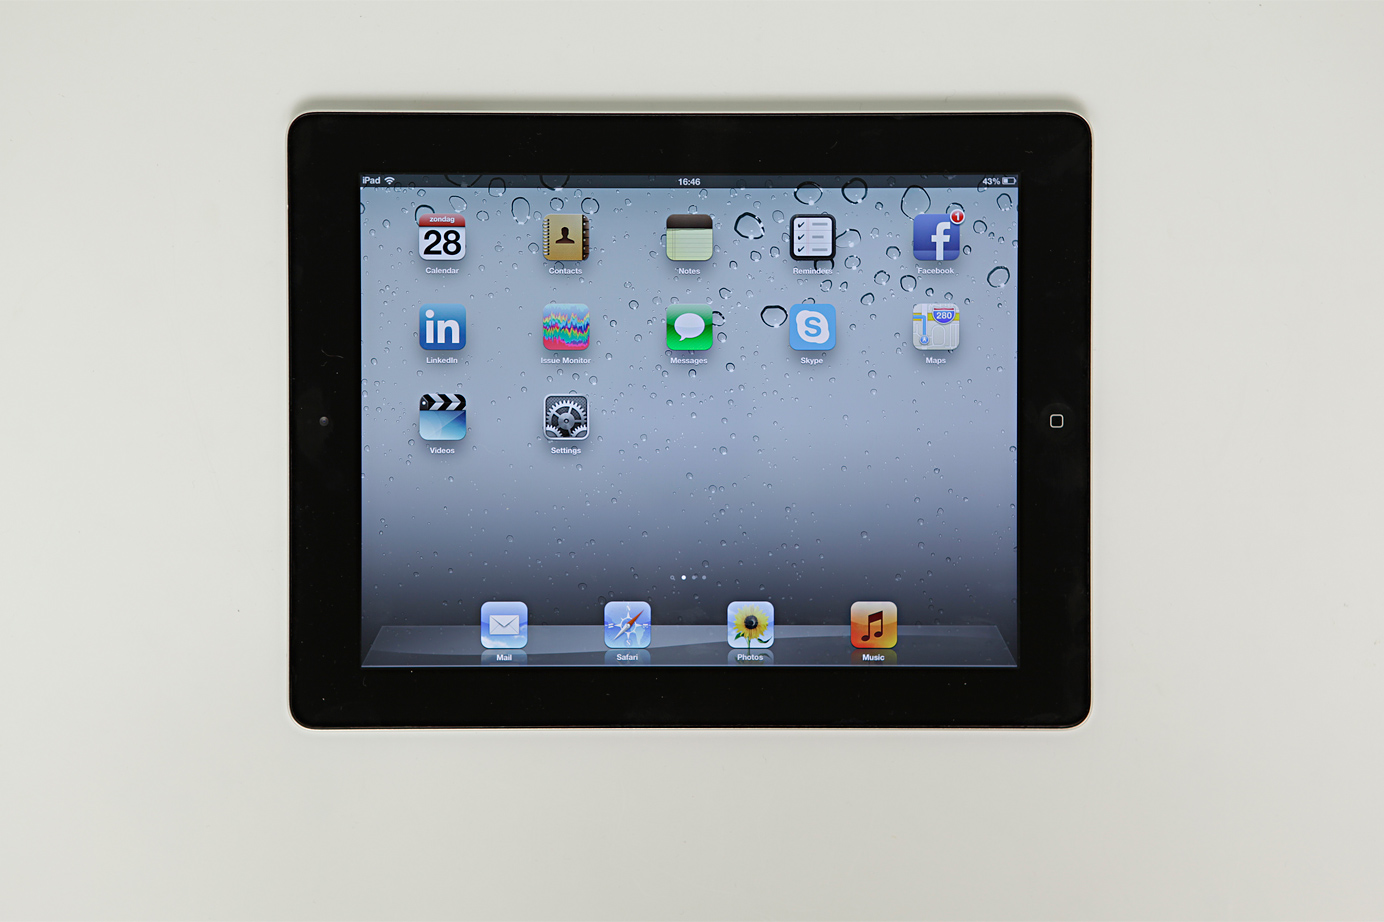 Creating a shortcut on the iPad home screen gives easy access to Attention Radar.